Thermal and Energy Modeling of Cluster Systems (Summer Research 2016)
There is urgent need to reduce the increasing energy cost of data centers[1]. Reducing temperature of data nodes could save cooling cost for data centers. The purpose of the research was to investigate the performance, thermal behavior, and power consumption of a cluster computing system. We studied the impact of different types of workloads on power consumption of a cluster. By conducting experiments with three benchmarks (Whetstone for CPU, nvidia-smi for GPU, and STREAM for memory), we generated statistical models that could predict the temperature of GPU and power consumption of CPU and main memory based on real-time utilizations. Experiments were then designed to identify these models. Furthermore, the cluster monitoring system was improved by adding support for the export of experimental data and the comparison between experiments on different data nodes among different time periods. The new monitoring system enables users to analyze the performance and energy consumption of scheduling schemes more efficiently.
The cluster we worked on is composed of 12 nodes with each running the Red Hat operating system. The nodes are built up with Intel Xeon E5530 microprocessor which has two dies with 4 cores each for a total of 8 cores.
- Master Node
- CPU: Intel Xeon E5530 (8 cores)
- Disks:
2* ST380215AS 80GB,
1*ST3500418AS (500 GB)
- Memory: 11.72 GB
- Computing Nodes
- CPU: Intel Xeon E5530 (8 cores)
- Disk: Seagate ST380215AS
- Memory: 16 GB
- GPU: Tesla C1060
- Operating System: Red Hat 4.1.2-55
- Kernel Version: Linux v 2.6.18-404.el5.centos.plus
|
|
|
|
To study the thermal behaviors and energy consumption of the cluster, we conducted several groups of experiments. We made use of inner temperature sensors to collect the CPU, GPU temperatures. The inlet and outlet temperature data were collected by exterior temperature sensors. We improved the cluster monitoring system to collect the temperature from all temperature sensors and activities of CPU, GPU and main memory. A Watts Up power meter was used to collect energy consumption, and a script program was developed to retrieve the energy consumption data and to send it to the cluster monitoring system.
CPU Energy Modeling
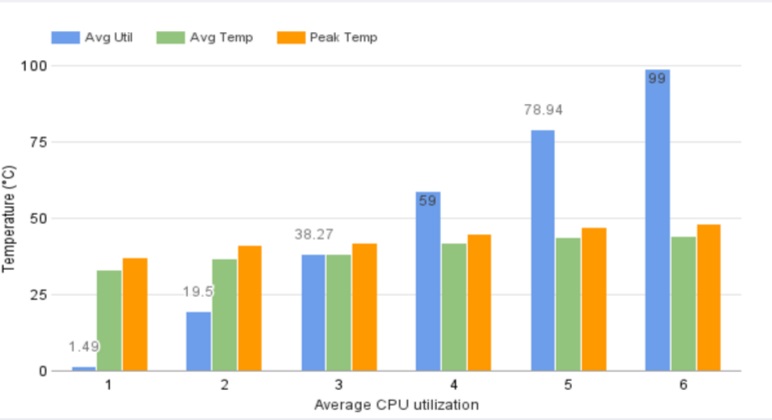
The Whetstone[2] benchmark was used to test the performance of floating point computations. We designed a group of experiments by driving CPU on a single cluster node running under different utilizations (while each core of CPU had the same utilization).
A variety of models were used and been evaluated with Residual sum of squares and R-squared. Since the patterns in the data fit a regression model well, we used training data with Linear Regression, Support Vector Regression and Polynomial model. Experimental results showed that the Polynomial model had fit to the data most closely and had an R-squared of 0.90, while Linear Regression and SVR had 0.88 and 0.84 R-squared values respectively. In order to make sure we are not overfitting to the data we have from the first experiment, we have conducted another series of experiments for testing the model.
 |
 |
| Figure 1. CPU temperatures under different CPU utilizations |
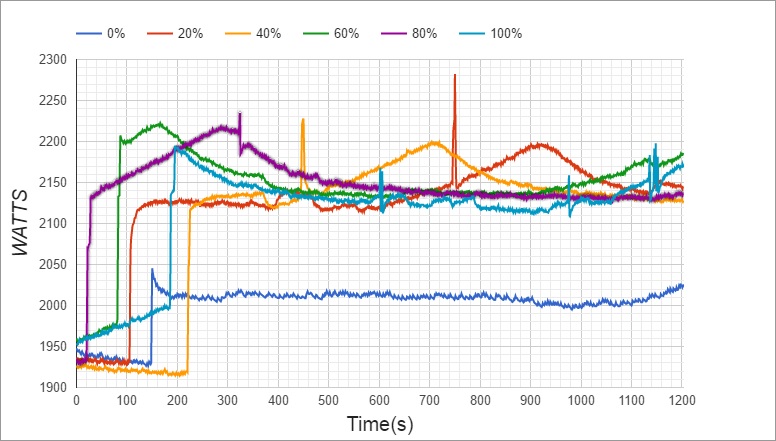
Figure 2. Comparison of energy consumption under different CPU utilizations |
(Figure created by Tugii.)
The polynomial regression model has been especially well suited for our problem domain and we have extensively tested out the validity and the robustness of the model by predicting the power consumption based only on CPU utilization and actually measuring the power consumption. We found the predictions of our model to closely resemble the actual power consumption with only minor differences (0.02%).
GPU Temperature Modeling
The slc program, which tries to cluster around 600,000 different 594-character-long DNA sequences, was used to stress test the GPUs’ capabilities. We used nvidia-smi[3] to monitor GPU’s fan speed - which we used as a base to compare GPU’s temperatures while we run the slc program.The cluster monitoring system that we built last summer was used to collect the actual data. When GPU was running under heavy workload (with average fan speed is 43%), its temperature increased from 59°C to 79°C. With the statistical modeling approach - specifically the SVR model, we was able to predict the GPU’s temperature based on its fan speed with the mean square error of 5.86 and the coefficient of determination R2 of the prediction of 0.76. The following figure shows the comparison of estimated GPU temperature with real measurements.
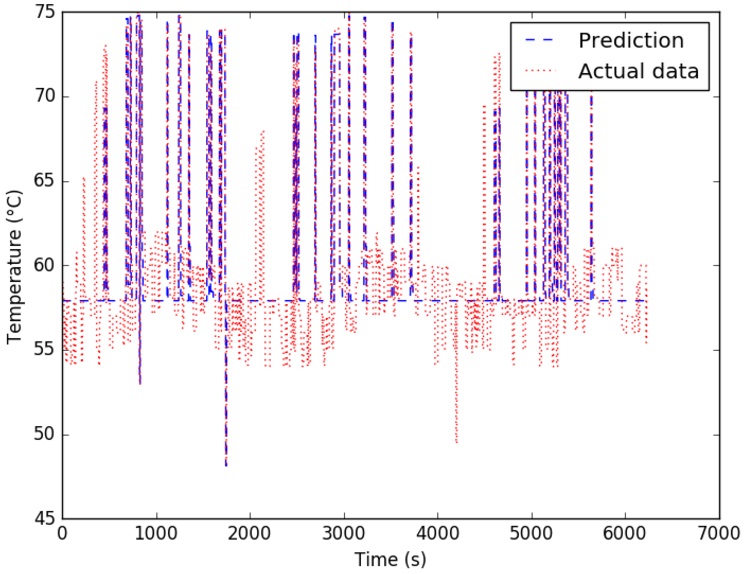
Figure 3. Comparison between predicted GPU Temperature and real measurements.
(Figure created by Lam.)
Memory Energy Modeling
The STREAM[4] benchmark was used to analyse the relationship between memory utilization and energy consumption. We conducted experiments by running the STREAM benchmark to see energy consumptions corresponding to different memory utilizations.
 |
 |
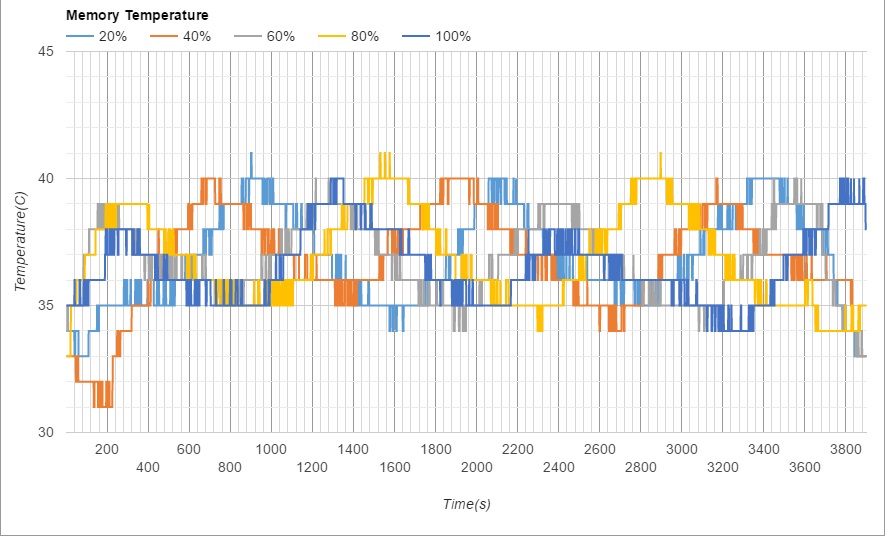
| Figure 4. Memory temperatures under different memory utilizations |
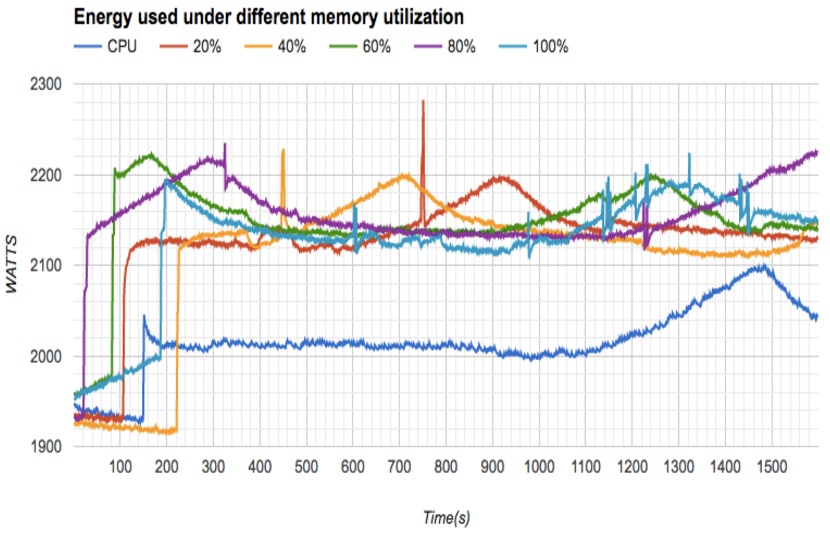
Figure 5. Comparison of energy consumption under different memory utilizations |
(Figure created by Daiki.)
As shown in the figure above, the total energy consumption of a single computing node increased by 200-300 Watts when the memory utilization was increased. It was obvious that high memory utilization resulted in higher energy consumption.
Cluster Monitoring System V2.0
Based on the cluster monitoring system v1.0 that was developed last summer (http://cluster.earlham.edu/profiling/), we added new functions to support the collecting of GPU and main memory data. The performance, temperature, and energy consumption of key components in computing nodes are visualized. With the updated monitoring system, users could explore the data in a specific time period.
In cluster monitoring system V2.0, new features are added:
- enable user management
- save data from historical database to archived database
- download data as CSV/XML files for further processing
- comparisons between multiple experiments
- enable saving data for future experiments on specified nodes within specified time period
 |
 |
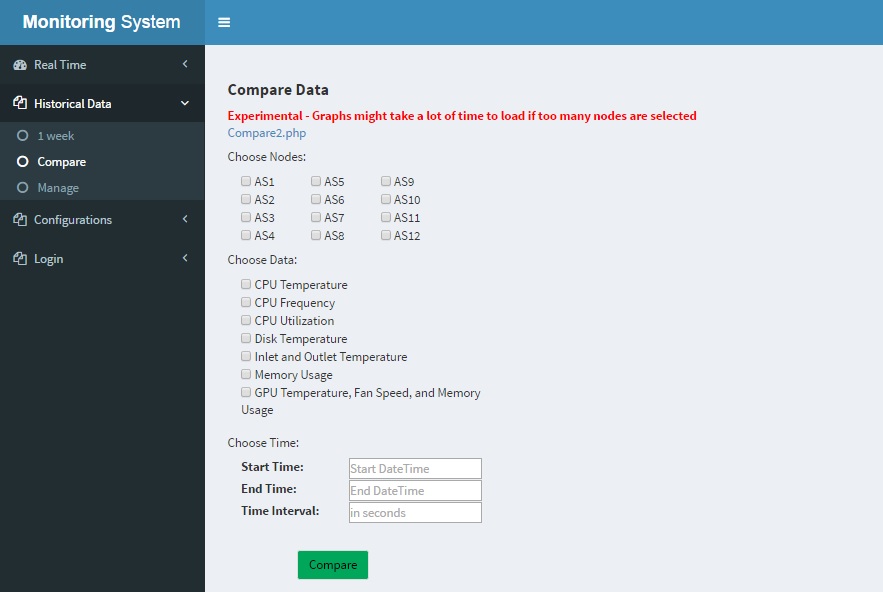
| (a) Comparison |
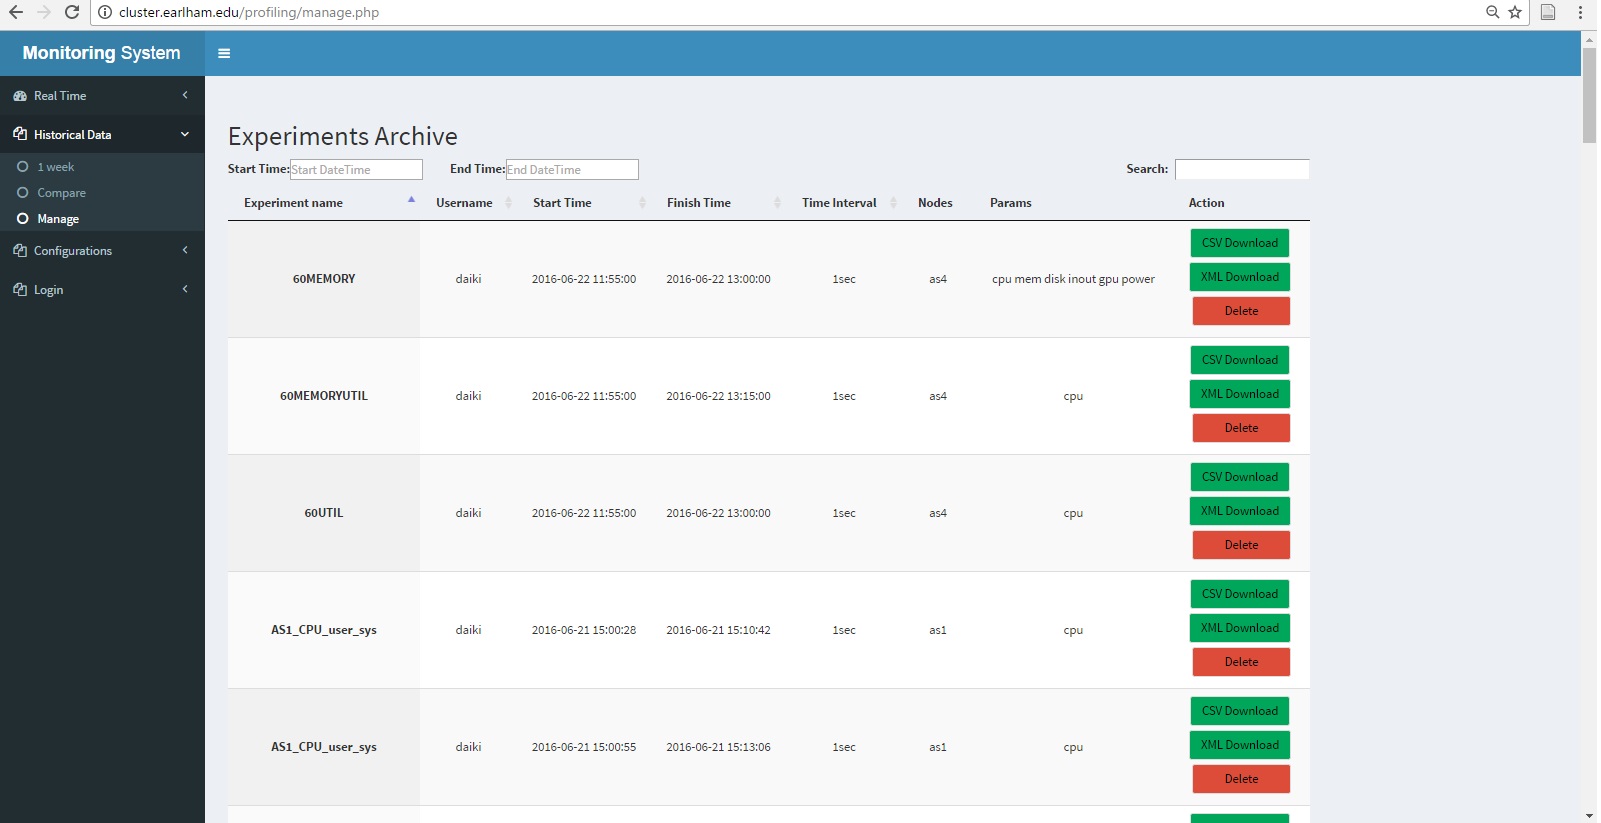
(b) Management |
| Figure 6. Cluster monitoring system V 2.0. |
|
As shown in Fig. 5(a), the comparison function enable user to compare the experimental data between different nodes with specified criteria in specified time period. Figures will be generated for each chosen criteria. In Fig. 5(b), all saved experiment would be displayed for administrator of the monitoring system. And for ordinary user, only experiments that are recorded by themselves will be accessed. Users could applied filters such as specifying the time period of the experiments, keyword in experiments name, and username to easily find the experiments they are looking for.
Conclusion and Future Work
We investigated the thermal and energy consumption of three key components in a computing node of a cluster system. Different models were applied to estimate the temperature or energy consumption. In the model we generated, only a single component was considered towards the energy consumption. In the future, we plan to combine the 3 models and estimate the total energy consumption by taking into account of the 3 components. In addition, we will study how workload will affect the energy consumption while using several different dispatch strategies. The final object of our research is to propose new strategies to improve the performance of the cluster system and reduce the energy consumption of the system.
Reference
1. http://www.datacenterdynamics.com/research/energy
-demand2011-12. Global data center energy demand forecasting. Technical report, institution, 2011.
2. Whetstone. http://www.netlib.org/benchmark/whetstone.c
3. Nvidia-smi. https://developer.nvidia.com/nvidia-system-management-interface
4. STREAM, https://www.cs.virginia.edu/stream/
Acknowledgements
1. Lemann Student/Faculty Collaborative Research Fund
2. Stephen and Sylvia Tregidga Burges Endowed Research Fund