Energy-Efficient Load Balancing on Cluster Systems (Summer Research 2017)

The purpose of the research was to investigate energy consumption of a cluster computing system under different task scheduling strategies and propose new strategies that could balance workload and reduce energy consumption. We studied the impact of different workloads on the power consumption of a cluster by conducting a variety of experiments with different benchmarks. Models for energy consumption based on activities of key components in a cluster were generated. We designed a group of experiments to learn how Hadoop worked to dispatch tasks among multiple nodes and how the dispatching would be affected problem input size. Different scheduling strategies (with PBS and Hadoop) were tested. Performance and energy consumption of running the same tasks on the cluster using PBS and Hadoop MapReduce were compared. Additionally, we progressed the work towards an efficient and functional real-time monitoring framework - with additional sensors to monitor inflow and outflow temperatures of our new cluster, a revised structure of the round robin databases used to store collected experimental data, and an improved and optimized monitoring website.

In this summer research, we worked on two clusters: the al-slam cluster and the whedon cluster. The al-slam cluster is composed of 12 nodes with each running the Red Hat operating system. The nodes are built up with Intel Xeon E5530 microprocessor which has two dies with 4 cores each for a total of 8 cores. And the whedon cluster is composed of 8 nodes with each node has 8 cores.

  • Master Node
    • CPU: Intel Xeon E5530 (8 cores)
    • Disks: 2* ST380215AS 80GB, 1*ST3500418AS (500 GB)
    • Memory: 11.72 GB
  • Computing Nodes
    • CPU: Intel Xeon E5530 (8 cores)
    • Disk: Seagate ST380215AS
    • Memory: 16 GB
    • GPU: Tesla C1060
  • Operating System: Red Hat 4.1.2-55
  • Kernel Version: Linux v 2.6.18-404.el5.centos.plus

To study the thermal behaviors and energy consumption of the cluster, we conducted several groups of experiments. We made use of inner temperature sensors to collect the CPU, GPU temperatures. The inlet and outlet temperature data were collected by exterior temperature sensors. We improved the cluster monitoring system to collect the temperature from all temperature sensors and activities of CPU, GPU and main memory. A Watts Up power meter was used to collect energy consumption of Al-slam nodes, and a script program was developed to retrieve the energy consumption data and to send it to the cluster monitoring system. And there are internal power meters on the whedon cluster that could be used to detect the power comusmption of each whedone node. Given the new Whedon cluster, we running two types of benchmark to study the power and temperature of the nodes.

Energy Benchmarking

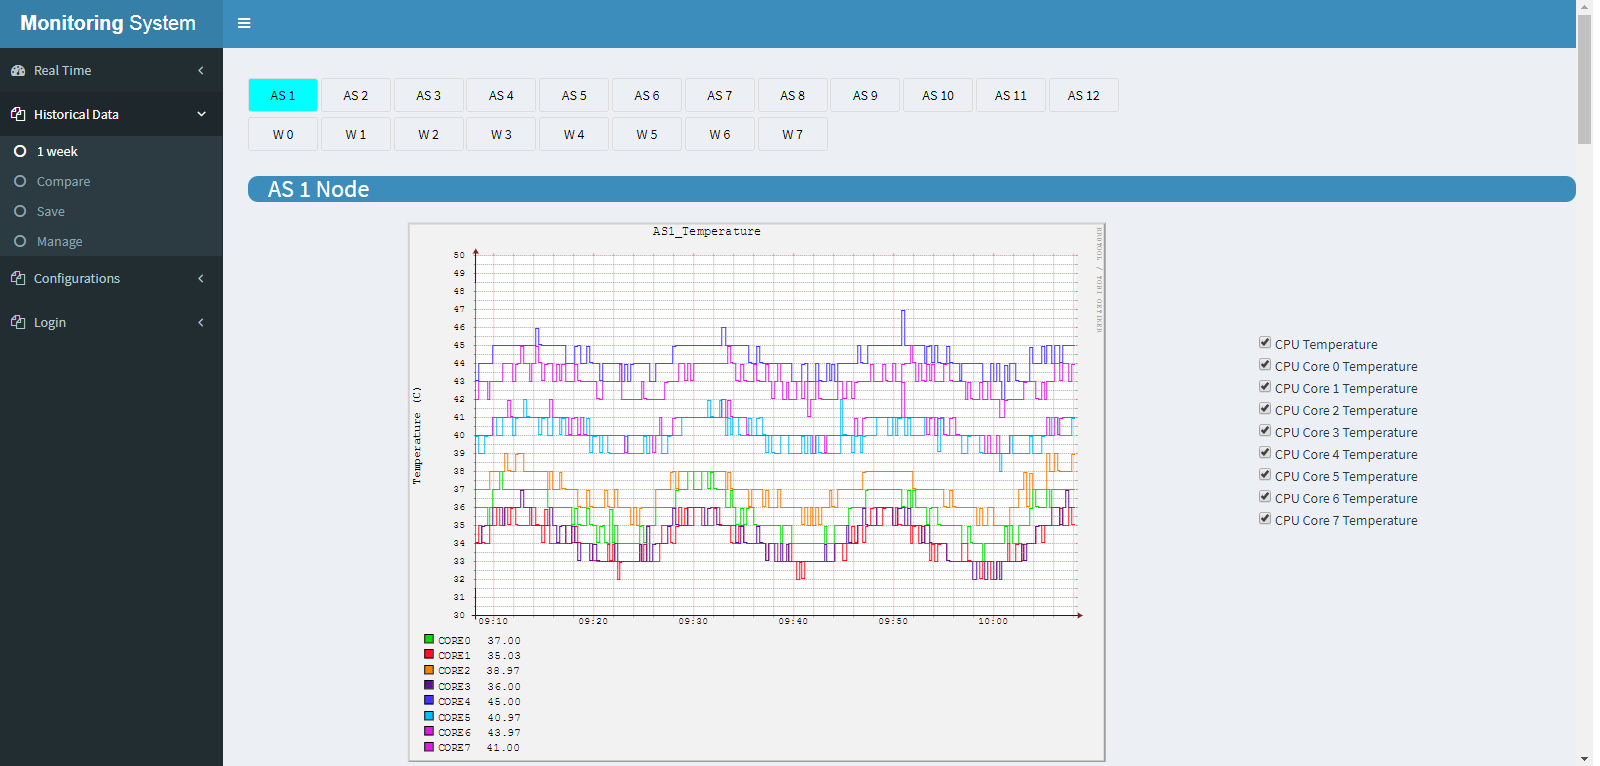
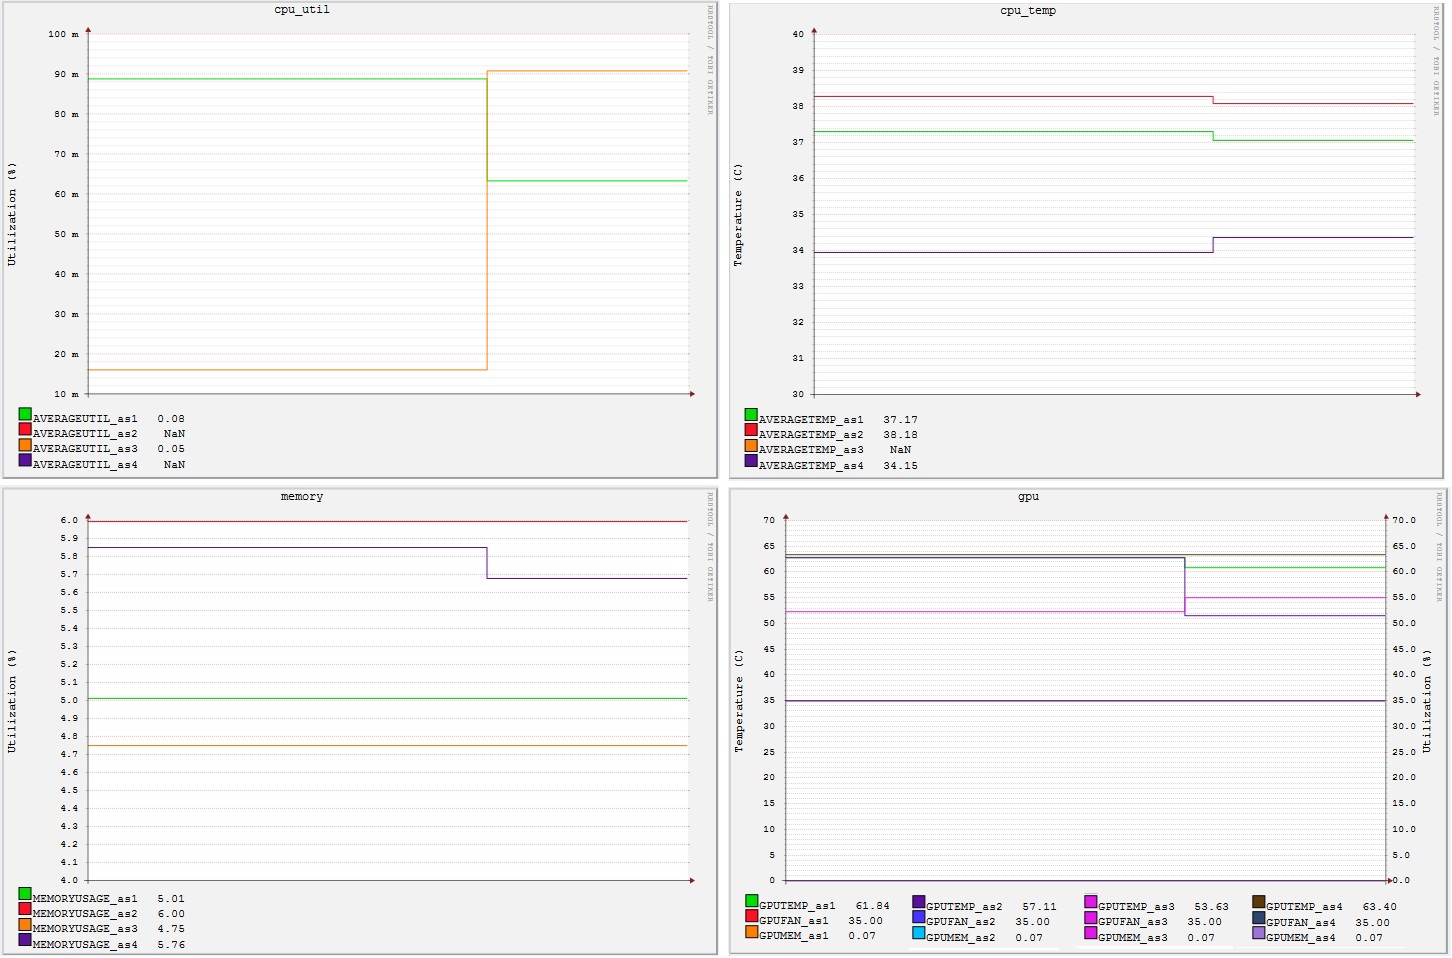
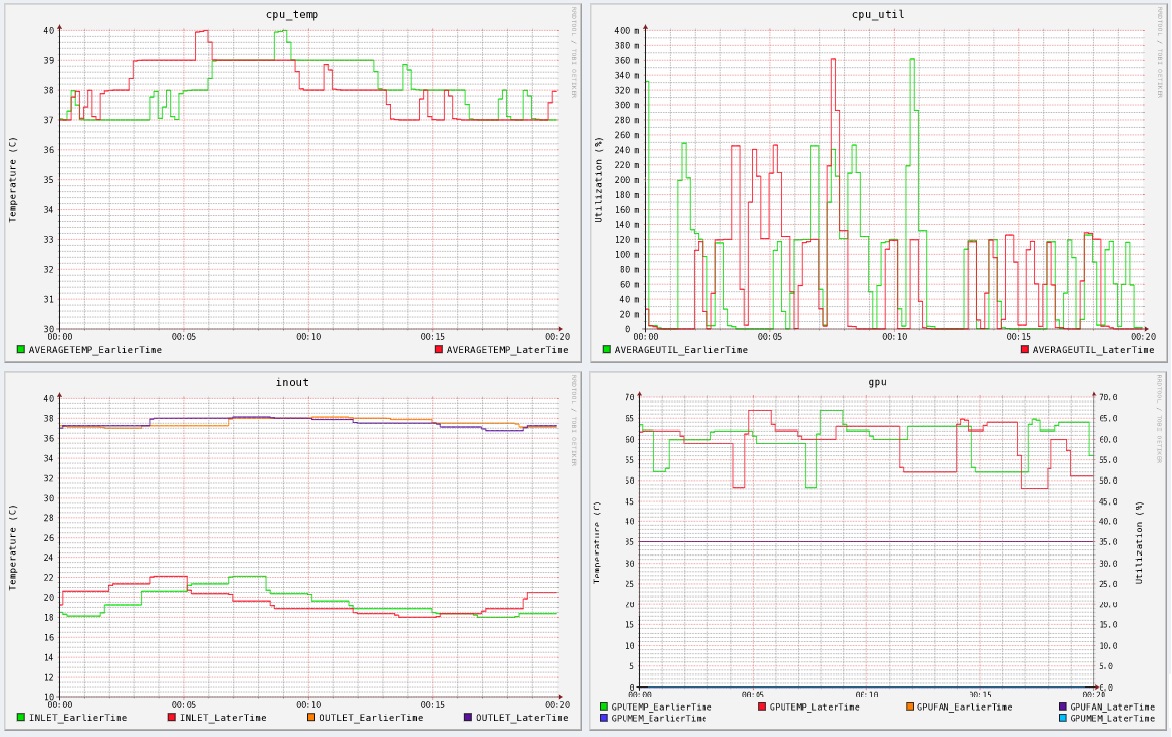
Benchmarks were used to study the power consumption and heat generation of our new cluster Whedon under various workloads. An array of 19 temperature sensors and a base unit were used to track the temperature of the air entering and exiting each computing node and the ambient temperature in the cluster room. We used Whetstone to simulate intensive workloads on the cluster’s central processing units (CPUs) and PostMark to create heavy loads on the cluster’s disks. We found a much clearer correlation between CPU utilization and energy use than with disk use. In addition, we run benchmarks (i.e., sort, wc, grep) to study how Hadoop worked to dispath tasks.

(Figure created by Eli Ramthun.)

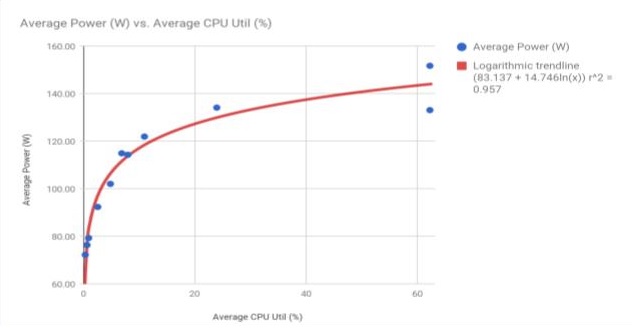
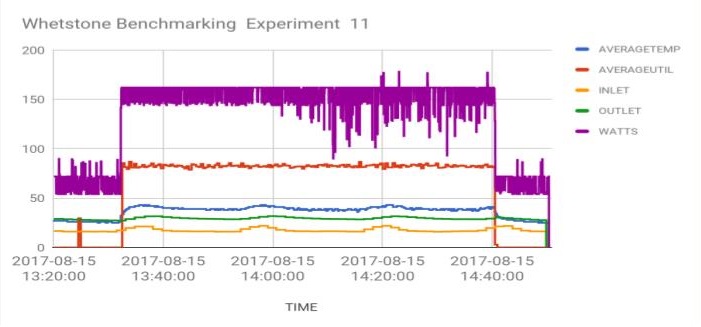
Figure 1. Raw data from one of the Whetstone benchmarking trials executed on Whedon Figure 2. Experimental results from 11 trials of Whetstone benchmarking on Whedon produced a clear logarithmic relationship between power drawn and CPU utilized.

In order to study how various load balancing techniques affect the power and total energy consumption, we designed experiments to compare sorting very large data files with two different workload distribution systems: (1) Hadoop, an open-source framework for large-scale distributed computing; (2) TORQUE, a resource management system for scheduling batch tasks.

We conducted a group of experiments using Hadoop's example benchmarks such as Grep, Sort, WordCount, and MultiFileWC to see how Hadoop handles different number of tasks, and how many Mapand Reduce tasks are assigned to nodes for each data set. We run the MultiFileWC for several times, including experiements that diferent number of files with the same size were used as the dataset, and files with the same total file size but differnt number of files. The experimental results could be found in the following figure.

(Figure created by Phuc Tran Hoang.)

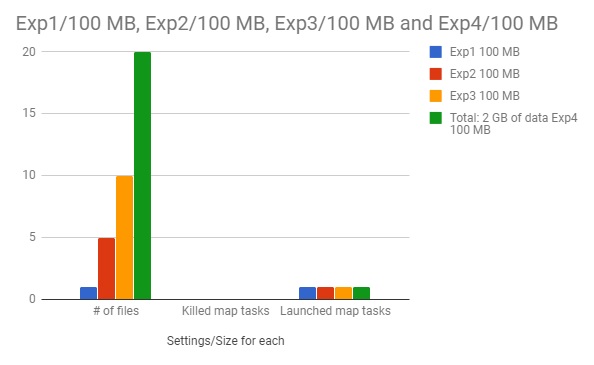
Figure 3. Experimental result of running MultiFileWC benchmarks on Hadoop

Cluster Monitoring System V3.0

We improved the real time monitoring system by redesigning the RRDtool database files and provide support for users to compare experimental results of different nodes at the same time period and results on the same node in different time periods. In the previous version, the web-based real-time graphing application would download entire datasets to graph each frame. We redesigned the graphing interface to only download data as it was needed, which significantly reduced the amount of network bandwidth used while running the application. In addition, the amount of data points for each monitored server proved to be a major obstacle in designing these interfaces. About 10 different measurements are logged on each machine. Graphing all these data points at once in a web browser is quite resource intensive. We limited the real-time visualization to one machine at a time to provide reasonable performance. We also improved the interfaces for downloading bulk data in various formats. The new system enable users to select time interval desired between individual data points, a choice between full file dump or relatively faster formatted data, full integration of our new cluster system. The backend functionality is also improved to increase the speed and reliability of data recording.

(Figure created by Niraj Parajuli and Byron Eamon Roosa.)

(a) One Week Historical Data (b) Interface for Recording Experiments
(c) Compare by Nodes (d) Compare by Time
Figure 4. Cluster monitoring system V 3.0.

As shown in Fig. 4(c), the comparison function enable user to compare the experimental data between different nodes with specified criteria in specified time period. Figures will be generated for each chosen criteria. In Fig. 4(d), users could compare experimental results on the same node at different time period. And for ordinary user, only experiments that are recorded by themselves will be accessed. Users could applied filters such as specifying the time period of the experiments, keyword in experiments name, and username to easily find the experiments they are looking for.

Conclusion and Future Work

In this project, we tackled several different areas relating to the monitoring and analysis of data center real-time perforamnce and environmental measurements. In setting up the monitoring sensors on our new HPC cluster, we found that server layout and physical configuration is an important consideration in the placement of environmental sensors. The new cluster has a slightly different layout than our older cluster (Al-slam), which meant that sensors had to be arranged to accurately measure airflow temperatures. Real time plotting remains as a significant challenge in data analysis. Monitoring large numbers of computers requires significant amounts of data transfer and must be carefully designed to avoid wasting computing resources. We made significant progress in terms of benchmarking our new cluster in order to understand the amount of power it will draw in real-world usage scenarios. There is still much work to be done. As the amount of servers is increasing, we need to make improvements in how data is collected to increase the overall efficiency of the monitoring system. As our workflow becomes more streamlined, it will be easier to examine other aspects of energy efficiency in the data center. The improved workflow should allow us to achieve more definitive results concerning the effects of different load balancing strategies on energy consumption of HPC systems.

Reference

[1]http://www.datacenterdynamics.com/research/energy-demand2011-12. Global data center energy demand forecasting.Technical report, institution, 2011.

[2] Nosayba El-Sayed, Ioan A. Stefanovici, George Amvrosiadis, Andy A. Hwang, and Bianca Schroeder. 2012. Temperature management in data centers: why some (might) like it hot. In Proceedings of the 12th ACM SIGMETRICS/PERFORMANCE joint international conference on Measurement and Modeling of Computer Systems (SIGMETRICS '12). ACM, New York, NY, USA, 163-174.

[3] Justin Moore, Jeff Chase, Parthasarathy Ranganathan, and Ratnesh Sharma. 2005. Making scheduling "cool": temperature-aware workload placement in data centers. In Proceedings of the annual conference on USENIX Annual Technical Conference (ATEC '05). USENIX Association, Berkeley, CA, USA, 61-74.

[4] Osman Sarood, Phil Miller, Ehsan Totoni, and Laxmikant V. Kale. 2012. “Cool” Load Balancing for High Performance Computing Data Centers. IEEE Trans. Comput. 61, 12 (December 2012), 1752-1764.

Acknowledgements

1. Scantland Summer Collaborative Research Gift

2. Ford/Knight Collaborative Research Fund