Energy-aware Management System on Cluster (Summer Research 2018)
In this research project, we designed a workload manager for workload distribution. This
workload manager could dispatch workload using different user specified strategies. We
studied how these workload distribution strategies affect the energy consumption of cluster
systems, and we sought to propose new strategies of balancing workload to reduce energy
consumption. We deployed new PDU to monitor the electrical power consumption of Al-slam
cluster where all our experiments in this summer were conducted on. In addition, we add a task manager module for archiving data to the cluster monitoring system (http://cluster.earlham.edu/profiling/), redesigned some of the existing modules, and
developed new modules to provide supporting for complex online data analysis.
In this summer research, all our experiments were conducted on the al-slam cluster which is composed of 12 nodes with each running the Red Hat operating system. The nodes are built up with Intel Xeon E5530 microprocessor which has two dies with 4 cores each for a total of 8 cores.
- Master Node
- CPU: Intel Xeon E5530 (8 cores)
- Disks:
2* ST380215AS 80GB,
1*ST3500418AS (500 GB)
- Memory: 11.72 GB
- Computing Nodes
- CPU: Intel Xeon E5530 (8 cores)
- Disk: Seagate ST380215AS
- Memory: 16 GB
- GPU: Tesla C1060
- Operating System: Red Hat 4.1.2-55
- Kernel Version: Linux v 2.6.18-404.el5.centos.plus
|
|
|

|
The electrical energy consumption was monitoring by a outlet-metered PDU(Power Distribute Unit). We developed programs to retrieve the energy data and store the data in our RRD database. We also designed a workload distribution manager which could dispath tasks submitted to our cluster. Three different workload distribution strategies were implemented and applied on our workload distribution manager. In addition, we improved the cluster monitoring system by introducing a new module which is used to mange the recording tasks. We also improved our real-time data visualization by reviewing the source code and remove the unnecessary downloading operations which largely improve the performance of data visualization.
Modeling Power based on CPU Workload
Benchmarks were used to study the power consumption and heat generation of our new cluster Whedon under various workloads. An array of 19 temperature sensors and a base unit were used to track the temperature of the air entering and exiting each computing node and the ambient temperature in the cluster room. We used Whetstone to simulate intensive workloads on the cluster’s central processing units (CPUs). We designed two groups of experiments by running Whestone:
- one thread running Whestone with one CPU core working under full utlization (%) and we increase the number of threads running the Whestone
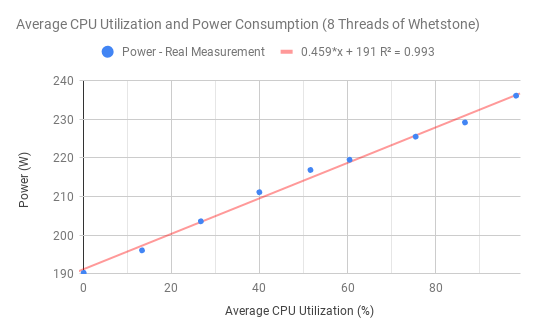
- 8 threads of Whestone with each thread running Whestone at the same utilization and we increased the utilization from 0% to 100%
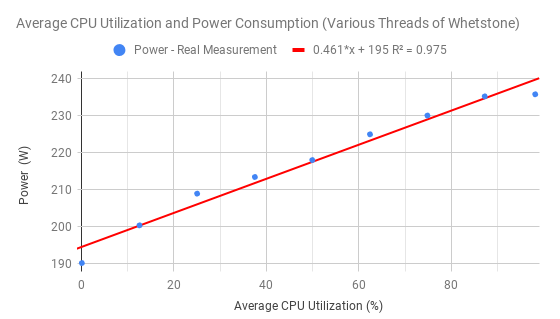
One of our primary experimental aims was to verify a linear relationship between CPU Utilization and power drawn per system. We used the synthetic benchmark Whetstone as well as the word-count tool wc to drive the CPUs running at set amounts of utilizations. Our monitoring system was used to collect the experimental data. We found linear regressions relating electrical power cost to CPU utilization with multiple Whetstone trials (as shown in Figure 1 and Figure 2) and wc (as shown in Figure 3).
The Whetstone trials were conducted using different utilization schemes within a single node - for instance, running 8 CPU cores at 12.5% is the same amount of average CPU utilization as running one out of eight cores at 100% utilization. Comparing these schemes and the consistent relationships they had with average CPU utilization and power consumption allowed us to verify the theoretical results that Cao et al. presented in their research[1] where data were generated using simulations.
(Figure created by Eli Ramthun.)
 |
 |
| Figure 1. Various Threads Whetstone. |
Figure 2. 8 Threads of Whestone. |
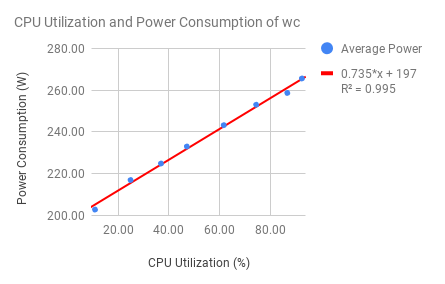 |
Figure 3. CPU Uitlization and Power Consumption of wc. |
Task Scheduling System and Strategies
We developed a task scheduling system based on PBS (Portable Batch System) and implemented different workload balancing strategies (i.e., uniform distribution, min-inlet temperature, and min-outlet temperature). These strategies were tested on our cluster, and the energy consumption of running under the same workload used these three strategies were collected. As shown in Figure 4, the min-outlet strategy outperformed the other two strategies when the number of tasks was larger than 12.
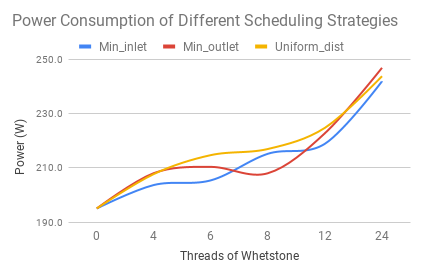 |
| Figure 4. Energy Consumption of using Different Scheduling Strategies. |
Cluster Monitoring System V4.0
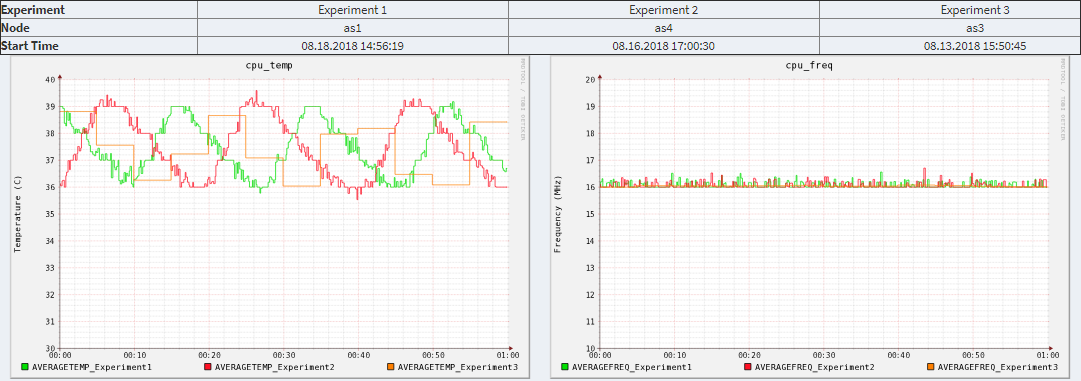
Two comparison modules (Compare by Time module and Complex Comparison module) were improved and implemented, which support users to perform flexible comparison of the performance and energy consumption for user specified experiments. These two modules enable user to do the data analysis of historical data online efficiently.
We reviewed the source code for real-time data visualization and improve the implementation to avoid duplicate data downloading when the web page was displayed on a browser. We also classified the figures in the real-time web page into two categories, and show only one category of figures according to users’ selection.
Furthermore, we developed a new module to manage the recording tasks in order to reduce the number of background running processes. The recording task manager will only lunch a process when a task’s starting time is reached. This module has not been finished yet, we will continue working this module in the future.
(Figure created by Thuy Thai.)
 |
| Figure 5. Complex Comparison in Cluster monitoring system V4.0. |
We developed the complex comparison module which enables users to compare different experiments on various criteria. For each experiment, users can specify the node and its starting time. As shown in Figure 5, the complex comparison module displays the comparison of experiments in graphs and list the information related to these experiments. In addition, a new designed module (recording task manager module) enables users to manage the recording tasks.
Conclusion and Future Work
We studied several thermal-aware workload balancing strategies that were focus on reducing
energy cost of data centers through reducing the cooling cost of computing devices. Our
research focus on the total energy cost of a cluster system, which including not only the cooling
cost but also the electrical power consumption. We generated models for estimating the
energy consumption based on utilization of two types of CPU-intensive workloads and validate
our models with real measurements. Our experimental results show that our energy model for
CPU-intensive workload has a high accuracy with the R2 is larger than 0.98. We developed a
workload manage system with a workload manager that controls the workload distributions
among the computing nodes on our cluster. We implemented the coolest-inlet, coolest-outlet
and uniform distribution strategies and investigated the total energy consumption of our
cluster using these three strategies with the same workload was submitted to our cluster.
According to our experimental results, applying the coolest-inlet and coolest-outlet strategies
consumed less energy than applying the uniform distribution strategy.
Reference
[1] T. Cao, W. Huang, Y. He, and M. Kondo, “Cooling-Aware Job Scheduling and Node Allocation for Overprovisioned HPC Systems,” 2017 IEEE International Parallel and Distributed Processing Symposium (IPDPS), pp. 728–737, 2017.
Acknowledgements
This research is funded by Stephen and Sylvia Tregidga Burges Endowed Research Fund,Lemann Student/Faculty Collaborative Research Fund at Earlham College.